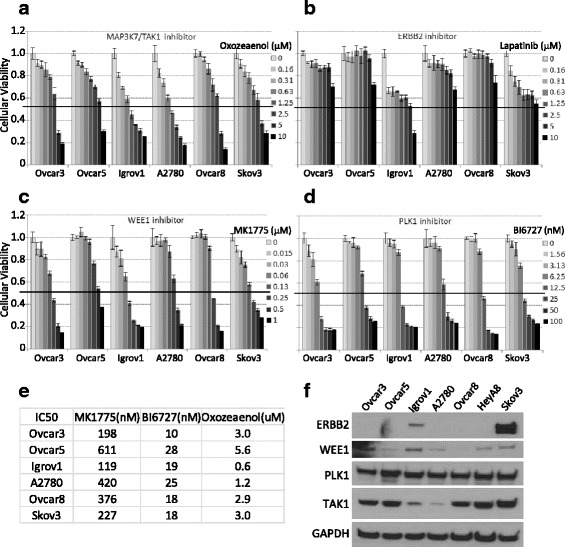
Fig. 3.

Evaluation of cellular toxicities upon pharmacological intervention a–d Cells were seeded at 1000 cells/well in 50 μl, 20–24 h prior to the addition of the drug in 50 μl. XTT assay was performed 3 days later upon drug treatment. The viability was calculated relative to no drug treatment and the error bars represent standard deviations calculated from three replicates. e IC50 values were calculated by CompuSyn after converting relative viability values to fraction affected numbers. f The steady-state level of each inhibitor target protein was examined by Western blotting analysis. Total 40 μg of proteins was separated on 4–12 % gradient gel and GAPDH was used as a loading control
