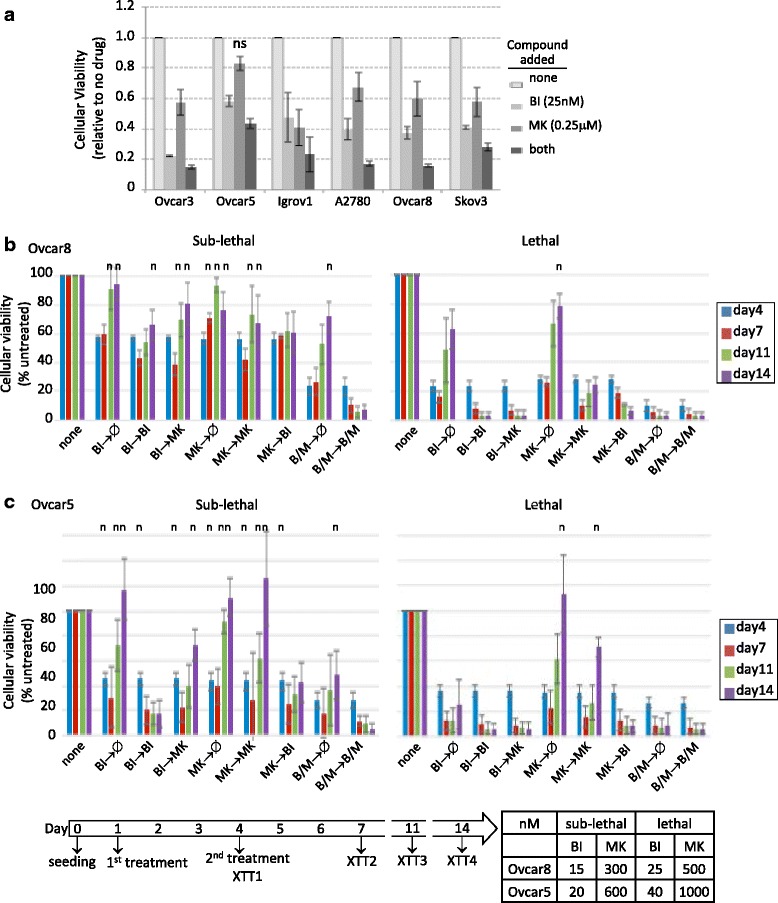
Fig. 5.

Cytotoxicity of different combination treatments a Cells were seeded at 2000 cells/well in 50 μl, 20–24 h prior to the addition of the drug in 50 μl. XTT assay was performed 3 days later upon drug treatments of PLK1 and TAK1 inhibitors. Statistical comparisons were calculated using two-way ANOVA with Dunnett post-hoc test, and p < 0.05 considered significant. All experimental conditions resulted in statistically significant differences from no-treatment control, except for MK alone in OVCAR5, indicated by ns. b, c OVCAR8 cells (b) or OVCAR5 cells (c) were seeded at 1000 cells/well in 50 μl. First drug was added in a 50 μl volume and then second drug was added in a 80 μl volume producing the indicated final drug concentration after removing 80 μl from each well. For days 7 and 14 time point plates, 150 μl of fresh complete medium was added after taking 150 μl of old culture. At Day11, fresh medium was added to day 14 plates in the same way. Of note, the cellular viabilities of untreated cells at days 11 and 14 were saturated and might not be accurately reflect in these graphs. The charts display compiled data from three independent experiments. For b and c, n indicates non-significant difference (p > 0.05) compared to no treatment, based on the Two-Way ANOVA test with a Dunnett post-hoc test
