
Fig. 5.
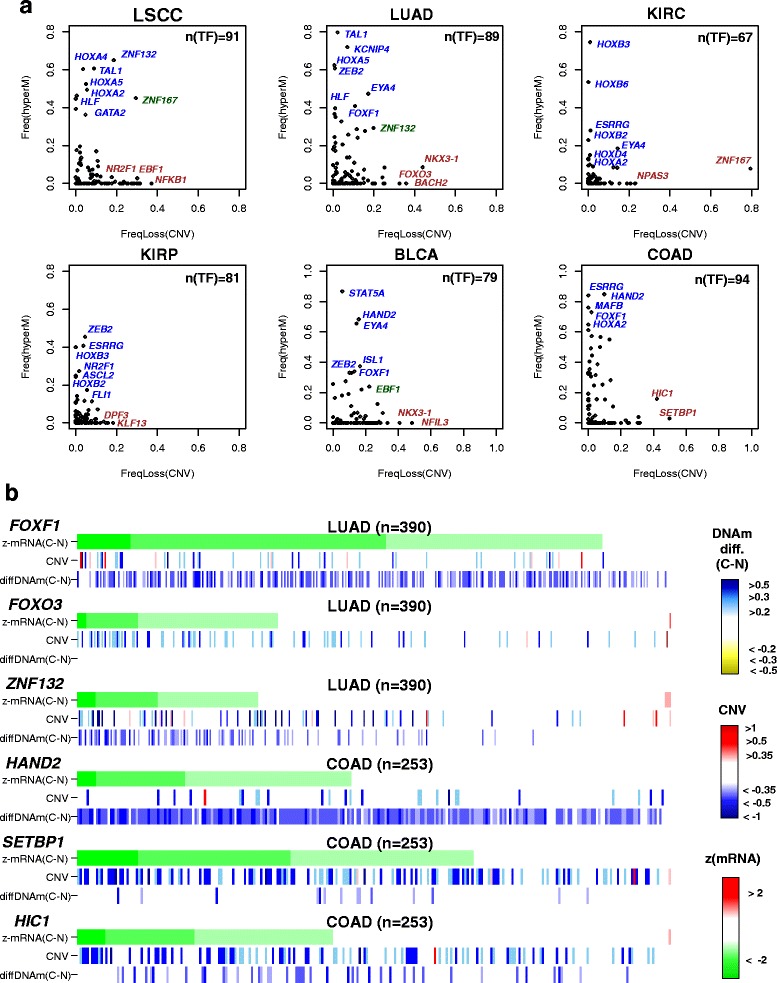
Cancer-silenced TFs exhibiting different propensities to undergo promoter DNA methylation or genomic loss in cancer. a Scatterplots of the frequency of genomic loss (x-axis) against promoter hypermethylation (y-axis) in cancer, as estimated over tumours exhibiting underexpression of the given TF. Each data point in the scatterplots represents one silenced TF. Some of the TFs exhibiting more propensity to undergo promoter DNAm than CNV loss are shown in blue, some TFs exhibiting less propensity to undergo promoter DNAm than CNV loss are shown in brown, and in green we highlight some TFs exhibiting both frequent CNV loss and promoter hypermethylation. b Heatmap representations of mRNA expression change (z-statistics of mRNA expression change), CNV and DNAm change (difference in beta-value between cancer and all normals) for a number of silenced TFs exhibiting different propensities for promoter hypermethylation and CNV loss in two different cancer types (LUAD and COAD), as indicated. Tumour samples are sorted in decreasing order of underexpression in cancer