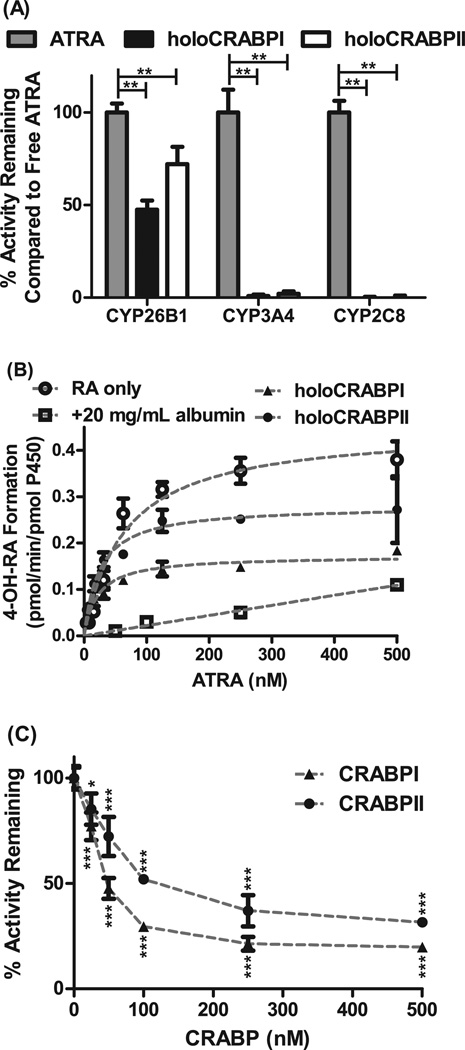
Figure 1. Effect of CRABP-I and CRABP-II on atRA metabolism by CYP26B1.
Panel A shows the 4-OH-RA formation from atRA by CYP26B1, CYP3A4 and CYP2C8 in the presence and absence of CRABP-I and CRABP-II. While atRA is metabolized efficiently by CYP26B1 in the presence of CRABP-I and CRABP-II, metabolism by CYP3A4 and CYP2C8 is completely prevented in the presence of CRABPs. (**p<0.001, two-way ANOVA with Bonferroni post-test) Panel B shows the determination of Km and kcat values for 4-OH-RA formation by CYP26B1 when holo-CRABP-I, holo-CRABP-II, free atRA or atRA bound with albumin is used as a substrate. The apparent Km and kcat values were 64.6 ± 10.3 nM and 0.45 ± 0.02 pmol/min/pmol CYP for free atRA, 21.7 ± 2.9 nM and 0.17 ± 0.006 pmol/min/pmol P450 for holoCRABPI, and 24.3 ± 4.2 nM and 0.28 ± 0.01 pmol/min/pmol CYP for holoCRABPII. Panel C shows the inhibition of CYP26B1 mediated 4-OH-RA formation by excess apo-CRABP. atRA concentration was 50 nM in this experiment. (*p<0.05, ***p<0.0001, one-way ANOVA with Dunnett post-hoc test).

