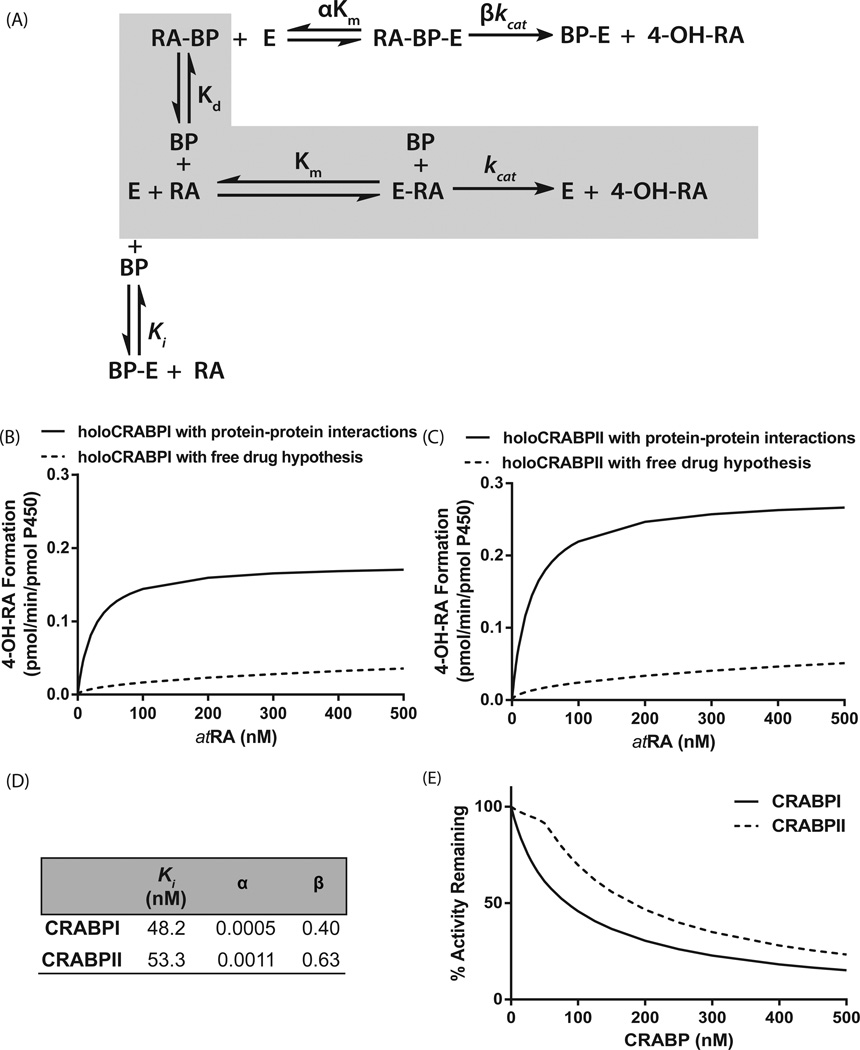
Figure 2.
Comparison of the models of the metabolism of atRA by CYP26B1 according to the free drug hypothesis and incorporating the protein–protein interactions between CRABPs and CYP26B1. Panel (A) shows the kinetic scheme of the interactions between CRABPs (BP), CYP26B1 (E), and atRA. The shaded gray area indicates the kinetic scheme for the free drug hypothesis, while the complete scheme shows the effect of substrate channeling and protein–protein interactions. Panels (B) and (C) show the simulated product formation curves in the presence of CRABP-I (B) and CRABP-II (C) using either the kinetic parameters obtained from a global fit to the data in Fig. 1B,C (solid lines, protein–protein interaction model) or using the independently measured kinetic constants in the absence of protein–protein interactions (dotted line, free drug hypothesis). The fitted kinetic constants for CRABP interactions with CYP26B1 according to the substrate channeling model are shown in panel (D). Panel (E) shows the simulated product formation curves in the presence of increasing concentrations of apo-CRABP using the kinetic constants from the global fit of the experimental data to the protein–protein interaction model. Using the fitted parameters shown in panel (D), velocity was calculated using Eqn (2) for a range of atRA and CRABP concentrations (0–500 nM) and plotted using GRAPHPAD PRISM v5. The simulations were conducted as described in Materials and methods section.

