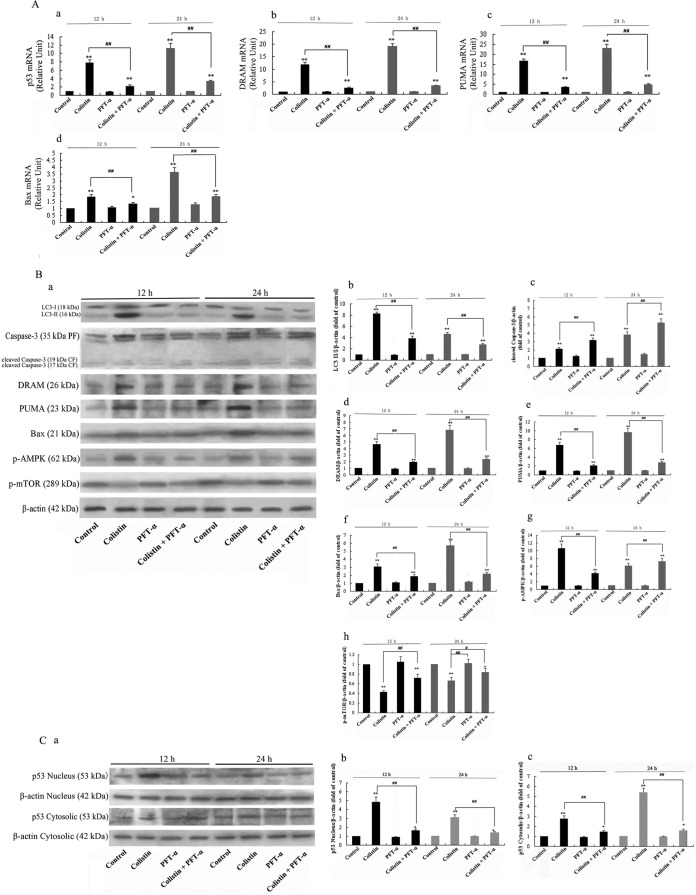
FIG 3.
Real-time PCR assay and Western blotting of key biomarkers in the p53 pathway and autophagy. (A) Detection of p53, DRAM, PUMA, and Bax mRNA levels by real-time PCR. The bar graph represents the mean percentages ± SD of apoptotic cells (n = 3). **, P < 0.01 for treated groups versus the untreated control group; ##, P < 0.01 for intergroup comparison among the treated groups. (B) Western blotting of LC3, caspase-3, cleaved caspase-3, DRAM, PUMA, Bax, p-AMPK, and p-mTOR. Samples containing 30 μg protein were loaded onto 15% (for LC3), 12% (for caspase-3 and cleaved caspase-3), or 10% (for DRAM, PUMA, Bax, p-mTOR, and p-AMPK) SDS-PAGE gels. β-Actin was used as a loading control. (a) Blots showing protein levels. (b to h) Quantitative data of protein levels. The bar graph represents the mean percentages ± SD of protein expression levels (n = 3). **, P < 0.01 for treated groups versus the untreated control group; ##, P < 0.01 for colistin only versus PFT-α plus colistin. (C) Blots showing levels of nuclear p53 and cytoplasmic p53. Detection was carried out using 10% SDS-PAGE gels, and β-actin was used as a loading control. (b and c) Quantitative data of p53 levels in each cellular fraction. The bar graph represents the mean percentages ± SD of protein expression levels (n = 3). **, P < 0.01 for treated groups versus the untreated control group; ##, P < 0.01 for colistin only versus PFT-α plus colistin.

