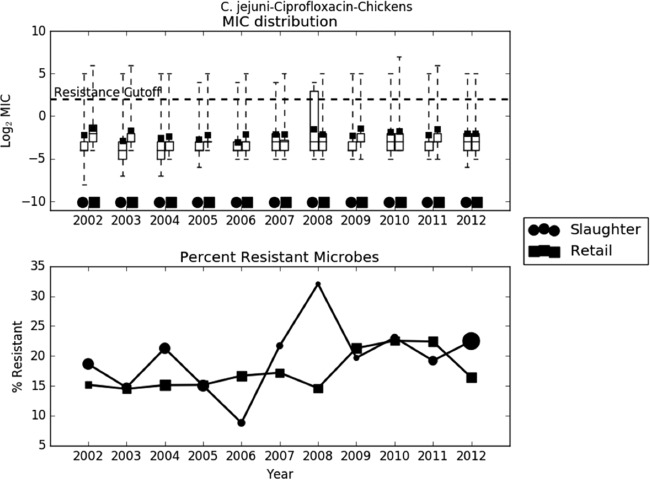
FIG 10.
Exploratory assessment of the 2005 tightening of enrofloxacin policy on Campylobacter jejuni resistance to ciprofloxacin. (A) Boxplots of log2 MIC values. The dashed line indicates the breakpoint between resistant and susceptible isolates. (B) Line graph of percentage of isolates with MIC values above the resistance breakpoint. Sizes of points are proportional to the number of observations in the given year and stage. Data from 2002 to 2003 are included in this analysis, as it is an assessment of a 2005 policy change. Ciprofloxacin is studied because it is the metabolic product of enrofloxacin. Sample sizes ranged from 78 to 1,348.

