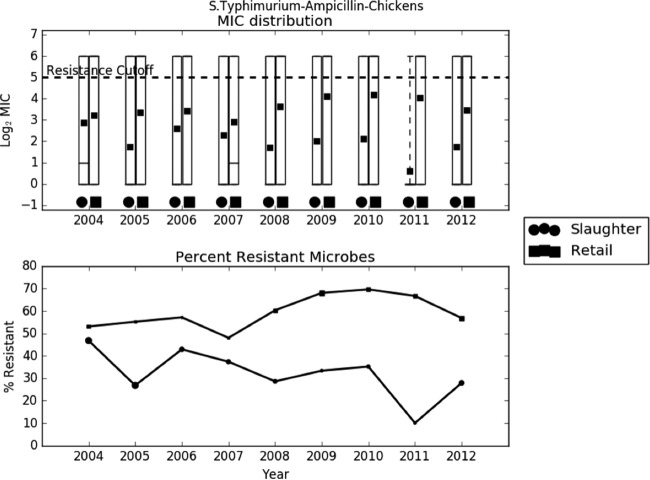
FIG 4.
Exploratory analysis of Salmonella Typhimurium resistance to ampicillin. (A) Boxplots of log2 MIC values. The dashed line indicates the breakpoint between resistant and susceptible isolates. (B) Line graph of percentage of isolates with MIC values above the resistance breakpoint. Sizes of points are proportional to the number of observations in the given year and stage. Samples sizes ranged from 21 to 104.

