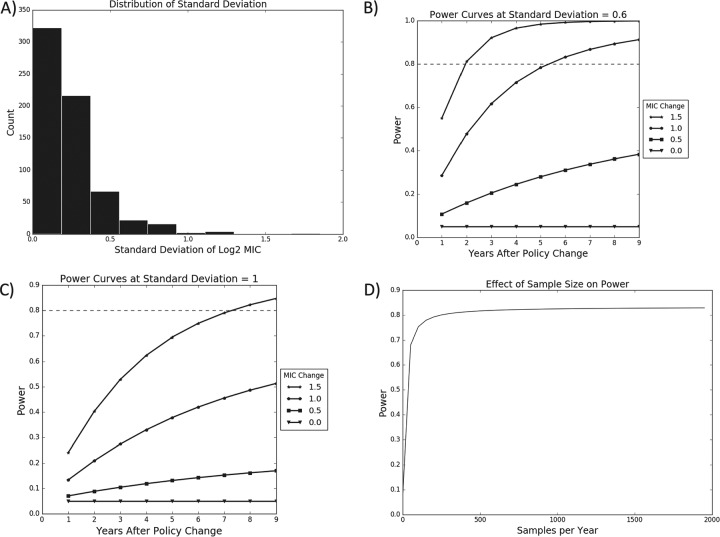
FIG 8.
Power analysis for testing changes in mean log2 MIC. (A) Distribution of empirical standard deviations across all bacterium, drug, and stage combinations. (B) Calculation of power assuming a standard deviation of 0.6. (C) Calculation of power assuming a standard deviation of 1. (D) Power of a test comparing 9 years before a policy change with 5 years after the change as a function of the number of isolates sampled each year. Dashed lines indicate a power of 0.8, the standard minimum power desired for a hypothesis test.

