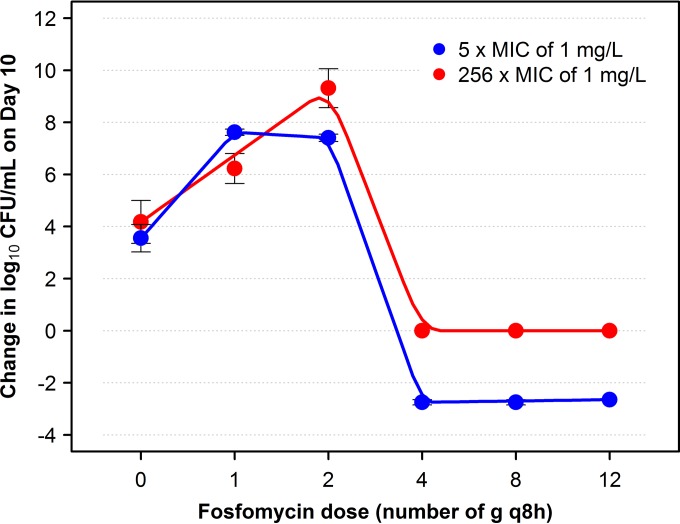
FIG 3.
Relationship between fosfomycin dosing regimen and change in log10 CFU/ml from baseline on day 10 of bacterial subpopulations with reduced fosfomycin susceptibility identified on drug-containing plates with 5× and 256× the baseline MIC. For each plotted point, which represents the average of two studies, the bars extend across the range of observed data.

