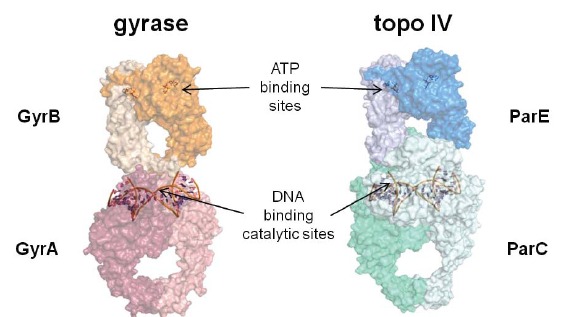
Fig. (4).

Models for bacterial Type II topoisomerase tetramers: DNA gyrase (left) and topoisomerase IV (right). The arrows show the relative locations of the ATP binding sites in GyrB and ParE and the DNA cleavage/ligation catalytic sites in GyrA and ParC which are shown binding the so-called “gateway” segment of DNA. Each monomer within the two tetramers is defined by a different color or shade of color. The models were constructed with S. pneumoniae ParC (PDB code 4I3H)[91]. E. coli ParE (1S16)[100], C. psychrerythraea 34H GyrA (3LPX), and E. coli GyrB (1EI1)[101] using the X-ray crystal structure of the complete tetramer from S. cerevisiae (4GFH)[102] as a template.
