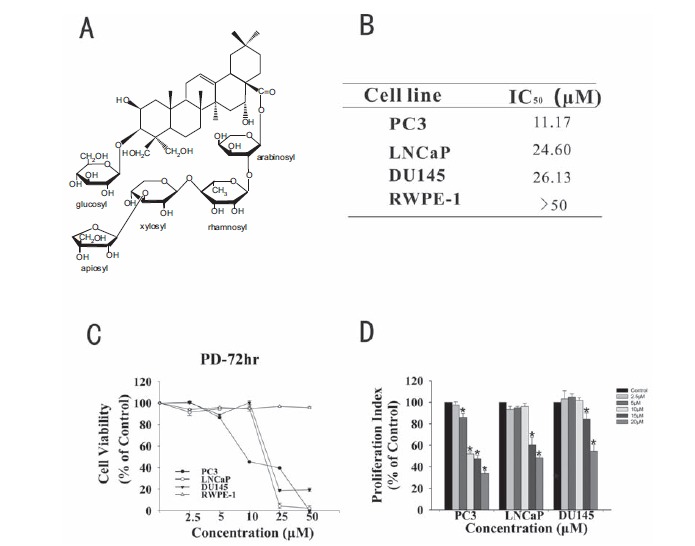
Fig. (1).

The growth inhibitory activity of PD in prostate cancer cells. A. The chemical structure of Platycodin D. B. The concentrations of PD that induced 50% growth inhibition (IC50) in prostate cancer cells, relative to the vehicle-treated control cells. C. Cells were exposed to various concentrations of PD for 72 hr, followed by the MTT assay. All assays were performed in triplicate. D. The anti-proliferative effects of PD were examined by the BrdUrd assay. (*, p<0.05 versus the control).
