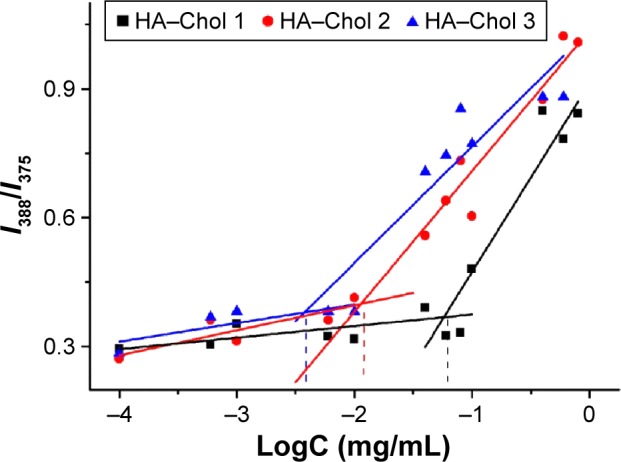
Figure 3.

The plot of fluorescence intensity ratio (I388/I375) to the logarithmic of concentration (LogC) of HA–Chol conjugates with different DSs.
Note: The CAC of HA–Chol with different DSs was the concentration under the inflection point of the curve.
Abbreviations: CAC, critical aggregation concentration; DS, degree of substitution; HA–Chol, hyaluronic acid–cholesterol conjugates.
