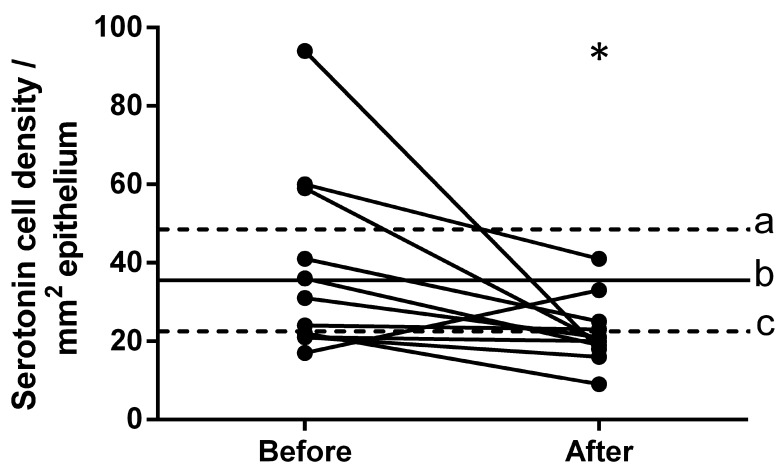
Figure 2.
Densities of serotonin-immunoreactive cells in the ileum of patients with IBS prior to and following dietary guidance. The dashed lines labeled ‘a’ and ‘c’ indicate the upper and lower limits of the 95% confidence interval for the serotonin cell density in the control subjects, respectively, whereas line ‘b’ indicates the mean serotonin cell density. *P<0.05, vs. the patients with IBS prior to dietary guidance. IBS, irritable bowel syndrome.

