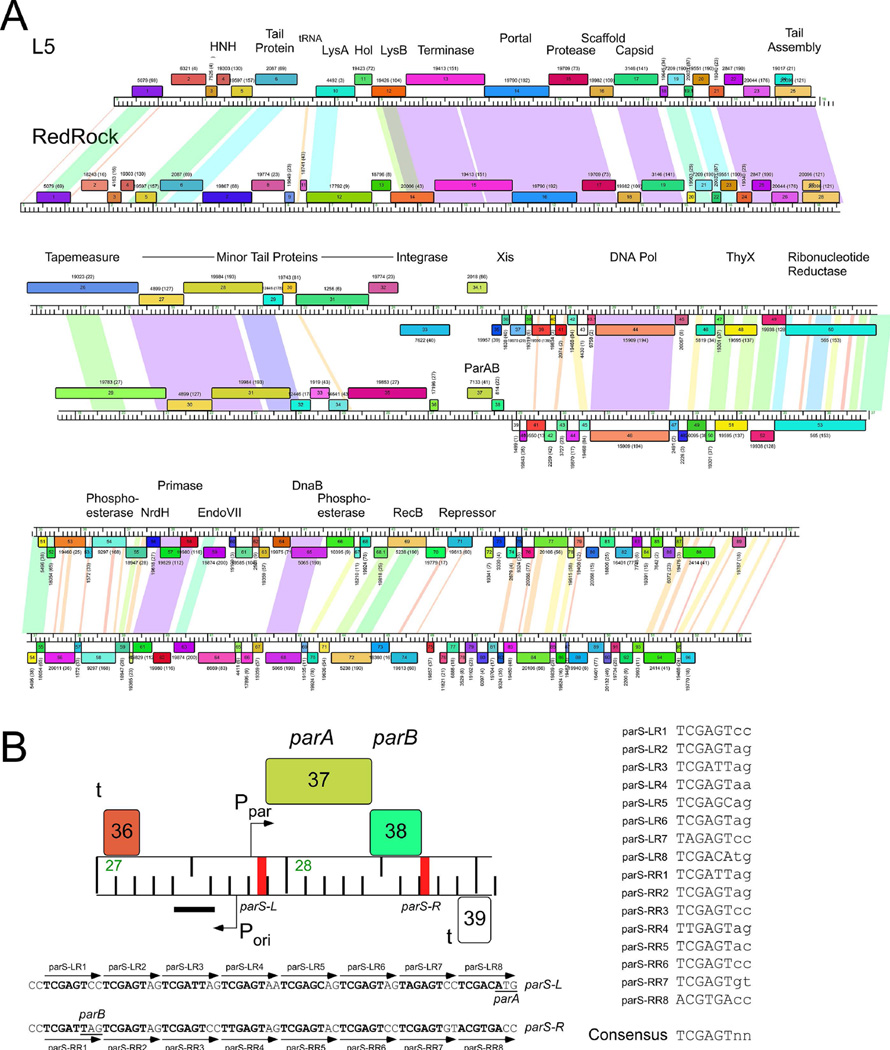
Figure 1.
The parABS system of mycobacteriophage RedRock. A. Alignment of genome maps of mycobacteriophages RedRock and L5. Both phages are grouped in Subcluster A2 and share similar genomic organizations and sequence similarity. However, at the centers of the genomes L5 contains an integration cassette (int, attP), whereas RedRock has parAB genes. Maps were generated using Phamerator (Cresawn et al., 2011). Predicted genes are shown as boxes transcribed rightwards or leftwards (shown above or below the genome ruler, respectively) with the gene number inside each box. Genes were assorted into phamilies (phams) of related sequences as described elsewhere (Cresawn et al., 2011, Pope et al., 2015), and colored according to pham membership; pham numbers are shown above or below each gene with the numbers of members in parentheses. Shading between genomes indicates nucleotide sequence similarity determined by BlastN and is spectrum colored with violet being the most similar. B. Detailed view of parABS organization. The parAB genes are transcribed rightwards and are flanked by centromere-like sites parS-L and parS-R. The location of putative promoters (P) and terminators (t) are shown, as well as a region (black bar) in which a non-coding RNA is highly expressed. Shown below are the sequences for parS-L and parS-R, with individual 8 bp repeat sequence motifs indicated, which are aligned to provide a consensus sequence on the right.

