Figure 3.
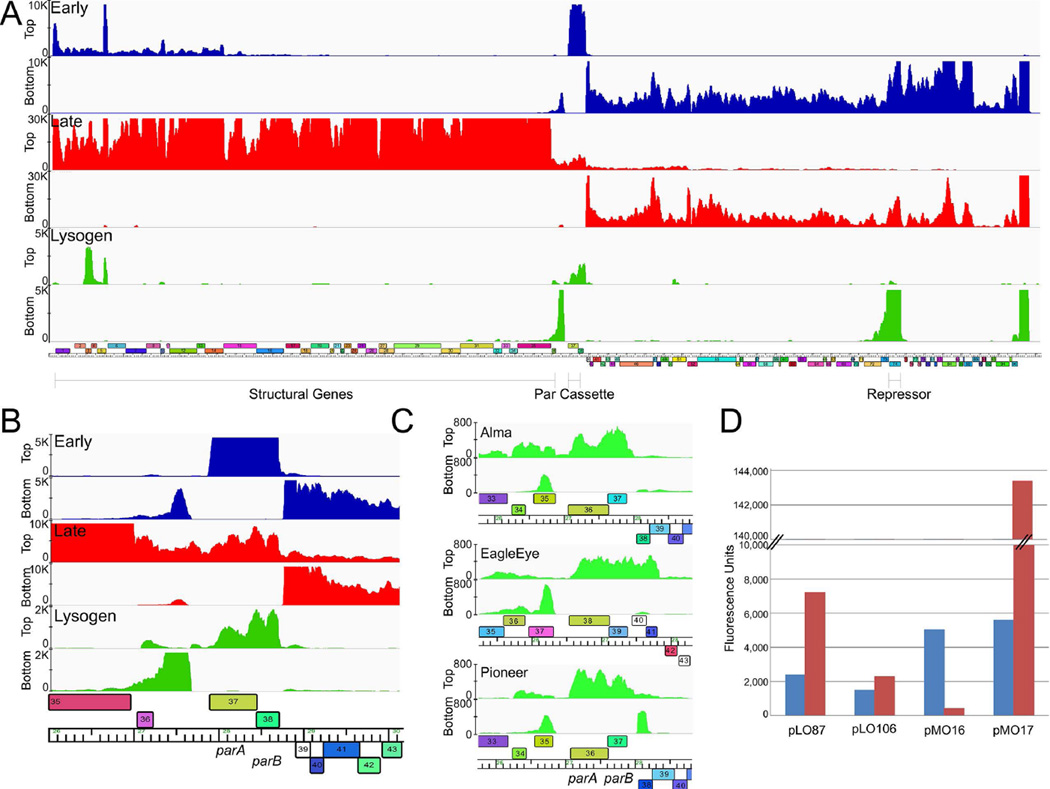
Expression and regulation of the RedRock parABS cassette. A. Strand-specific RNAseq analysis of a RedRock lysogen (green) and at early (30 mins; blue) and late (150 mins; red) times post-infection. Lanes corresponding to top and bottom strand sequence reads and scale maxima are shown at the left. A map of the RedRock genome is shown below. B. Details of parAB expression. Profiles are colored as in panel A. C. Detailed view of the RNAseq profiles of the parAB genes from Alma, EagleEye, and Pioneer lysogens. The full genome profiles are shown in Fig. S5. D. Reporter gene expression of par-promoters. The fluorescence of M. smegmatis strains containing mCherry reporter plasmids, as indicated, is shown. Strains also lacked (blue bars) or contained (red bars) integrating plasmid pMO15 in which RedRock ParB is expressed from the hsp60 promoter. Reporter plasmids contain the following promoters: hsp60 (pLO87), phage BPs p6 (pLO106), Ppar (pMO16), and Pori (pMO17) (see Fig. 1).

