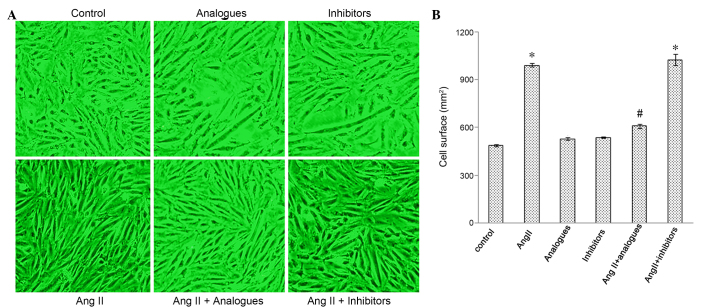
Figure 3.
Changes to myocardial cell surface area observed following transfection with miR-155 analogue or inhibitor and/or treatment with AngII. (A) Micrographs of the cells (magnification, ×200); (B) Cell surface area among the groups. *P<0.05, vs. the control group; #P<0.05, vs. the AngII group. AngII, angiotensin II.

