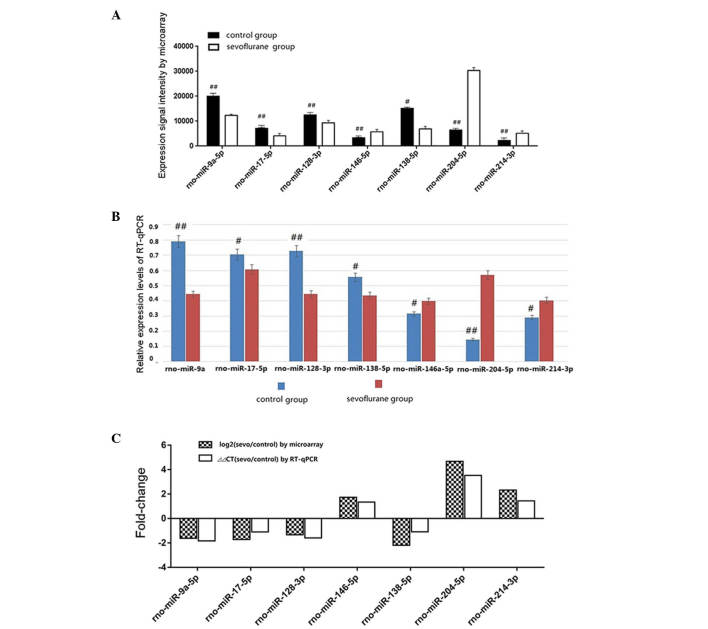
Figure 2.
Correlation of miRNA between microarray and RT-qPCR. (A) Results of relative detectable signal intensity of differentially-expressed miRNAs between the sevoflurane and control groups by microarray. (B) The results of the relative expression level of differentially-expressed miRNAs analyzed by qPCR. (C) Comparison of qPCR observations to microarray results by fold-change of 7-selected miRNAs. #P<0.05, ##P<0.01. RT-qPCR, reverse transcription-quantitative polymerase chain reaction.

