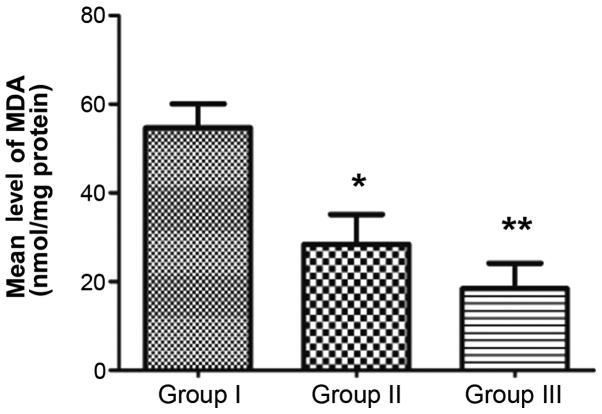
Figure 9.
Mean MDA level in the three groups. *P<0.05 vs. group I; **P<0.05 vs. group II. Group I, control group that was injected with 10 mg/kg saline once per day; group II, experimental group that was injected with 10 mg/kg diammonium glycyrrhizinate (DG) once per day; group III, experimental group that was injected with 10 mg/kg DG twice per day. MDA, malondialdehyde.

