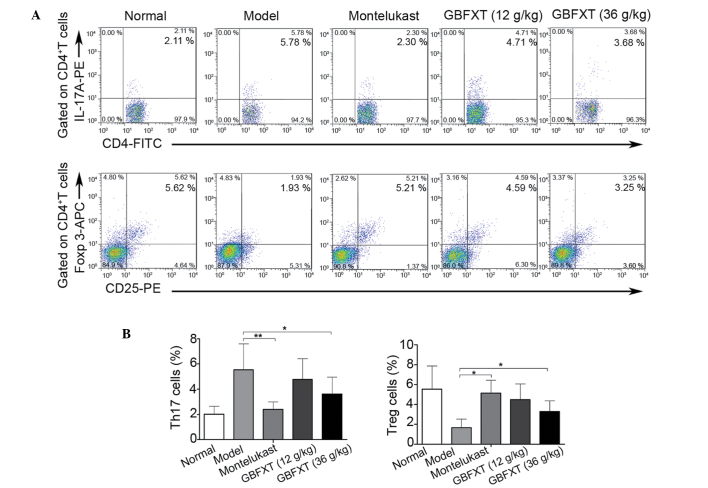
Figure 5.
Effect of GBFXT on Th17 and Treg cells. (A) Representative FACS flow cytometry profiles; and (B) percentages of Th17 cells and Treg cells in various groups. One representative of 10 mice in each group is shown in the FACS profiles. Values represent the mean ± standard deviation of 10 mice. *P<0.05 and **P<0.01, vs. model group. GBFXT, Gu-Ben-Fang-Xiao-Tang; FACS, fluorescence-activated cell sorting; IL, interleukin; PE, phycoerythrin; FITC, fluorescein isothiocyanate; Foxp 3, forkhead box P3; APC, allophycocyanin; Th17, T helper 17; Treg, regulatory T.

