
Figure 3.
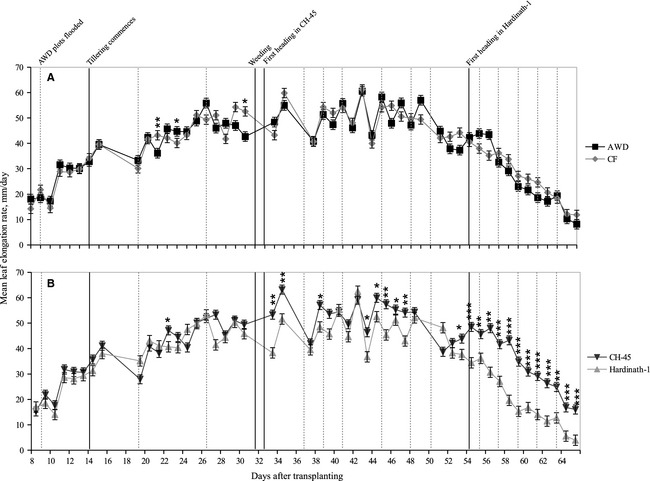
Mean leaf elongation rate, (A) Under two irrigation treatments (alternate wetting and drying, AWD and continuous flooding, CF) averaged across genotypes, and (B) In two different cultivars (CH‐45 and Hardinath‐1), averaged across treatments. Bars show ±1 standard error of 30 replicates per genotype/treatment combination. Dashed lines indicate approximate dates of flooding in AWD plots. Solid lines show key physiological and management events. Asterisks as for Figure 2 (Mann–Whitney U‐test).