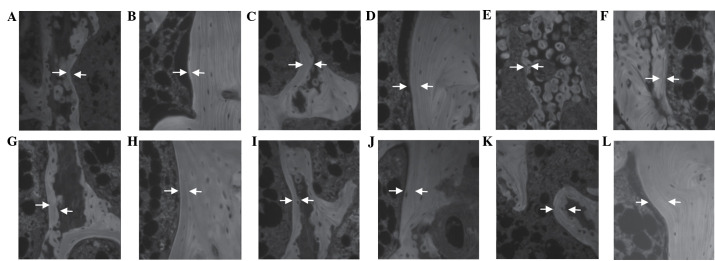
Figure 2.
Fluorescent histological profiles of the femur of the (A and B) sham, (C and D) ovariectomized (OVX) control and (E and F) alendronate-treated groups, and the (G and H) 31.25, (I and J) 62.5 and (K and L) 125 mg/kg Polycan-treated groups. The mineral apposition rate (MAR) was markedly increased in the trabecular and cortical bone regions of the femur in the Polycan-treated rats, in a dose-dependent manner, as compared with the OVX control group. Conversely, the MAR was markedly decreased in both bone regions of the femur in the alendronate-treated rats, as compared with the OVX control group. A, C, E, G, I and K display trabecular bone regions (magnification, ×200); B, D, F, H, J and L display cortical bone regions (magnification, ×200). Arrows indicate the tetracycline and calcein labeled lines. The distant between the arrows represents the MAR over a 10-day period.

