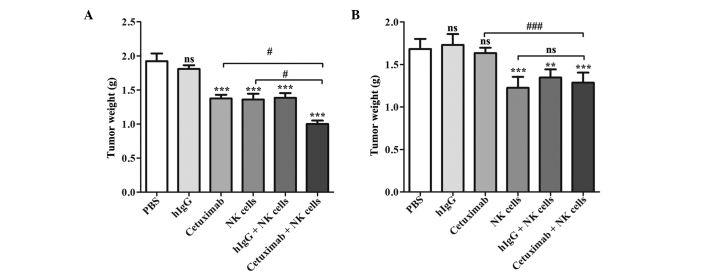
Figure 3.
Tumor weights of (A) LOVO and (B) SW620 xenografts. Differences between groups were determined by the Bonferroni test. nsP>0.05, **P<0.01 and ***P<0.001 compared with the PBS-treated control group (top of bar); nsP>0.05, #P<0.05 and ###P<0.001 compared with the cetuximab plus NK cells group (line connecting bars). PBS, phosphate-buffered saline; hIgG, human immunoglobulin G; NK, natural killer.

