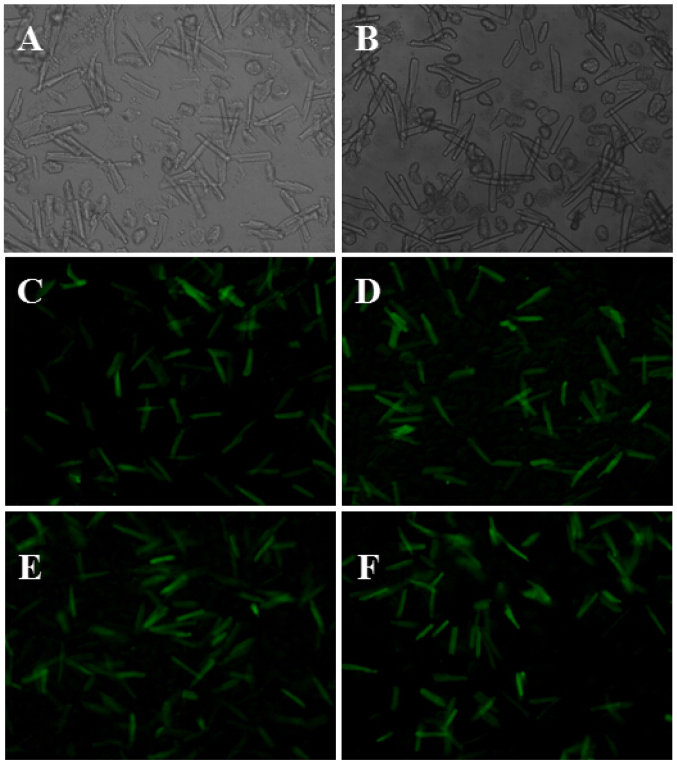
Figure 1.
Expression of green fluorescent protein after 48 h myocardial cell culture, detected by a fluorescence microscope. Myocardial cells in: (A) Sham group (×100 magnification); (B) HF group (×100 magnification); (C) sham+β2 group (×100 magnification); (D) HF+β2 group (×100 magnification); (E) sham+EGFP group (×100 magnification); and (F) HF+EGFP group (×100 magnification).

