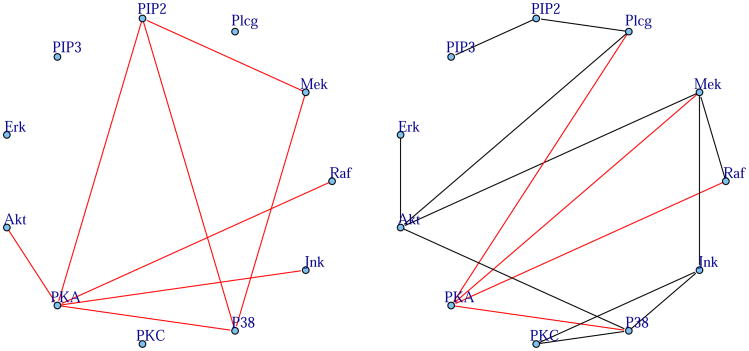
Figure 5.
Cell signaling network estimated from flow cytometry data via exponential graphical models (left) and Gaussian graphical models (right). The exponential graphical model was fit to un-transformed flow cytometry data measuring 11 proteins, and the Gaussian graphical model to log-transformed data. Estimated negative conditional dependencies are given in red. Both networks identify PKA (protein kinase A) as a major inhibitor, consistent with previous results.

