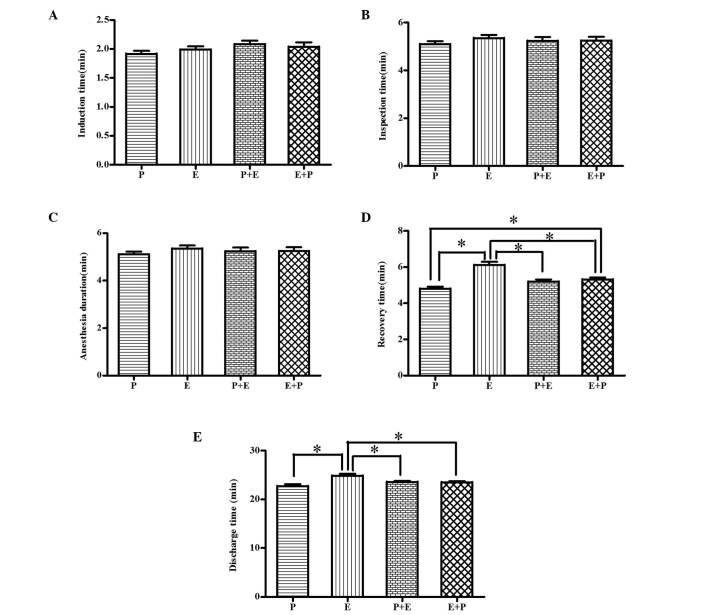
Figure 2.
(A) Induction time, (B) inspection time, (C) anesthesia duration, (D) recovery time and (E) discharge time of the four study groups (n=50). Data are presented as the mean ± standard deviation. *P<0.05. P, propofol (1.5–2.0 mg/kg); E, etomidate (0.15-0.2 mg/kg); P+E, propofol (0.75–1 mg/kg) followed by etomidate (0.075-0.1 mg/kg); E+P, etomidate (0.075-0.01 mg/kg) followed by propofol (0.75–1 mg/kg).

