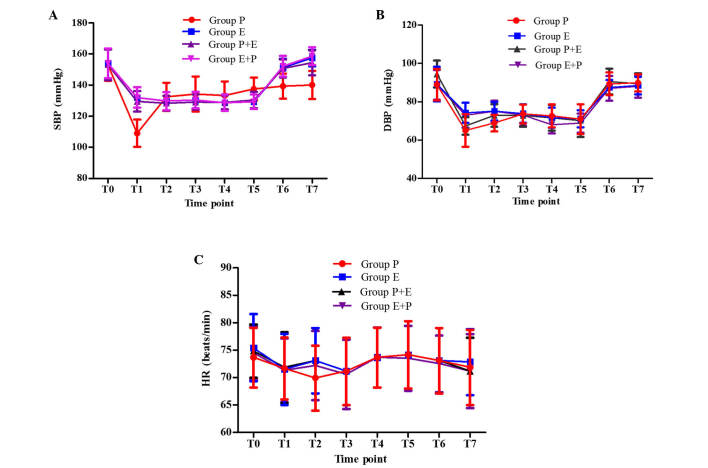
Figure 3.
Mean (A) SBP, (B) DBP and (C) HR levels of the four study groups (n=50) during gastroscopy. Data are presented as the mean ± standard deviation. There was a significant difference between SBP in group P at T1 compared with T0 (P<0.05), and there were significant differences in SBP at T0 compared with SBP at T1, T2, T3, T4, T5 and T6 in group P (P<0.05). In addition, there were significant differences in SBP at T0 compared with T1, T2, T3, T4 and T5 in groups E, P+E and E+P (P<0.05). Furthermore, there were significant differences in SBP at T1 compared with T6 and T7 in groups E, P+E and E+P (P<0.05). However, there were no significant differences in HR in any groups (P>0.05). SBP, systolic blood pressure; DBP, diastolic blood pressure; HR, heart rate; P, propofol (1.5–2.0 mg/kg); E, etomidate (0.15-0.2 mg/kg); P+E, propofol (0.75–1 mg/kg) followed by etomidate (0.075-0.1 mg/kg); E+P, etomidate (0.075-0.01 mg/kg) followed by propofol (0.75–1 mg/kg).

