
FIGURE 4.
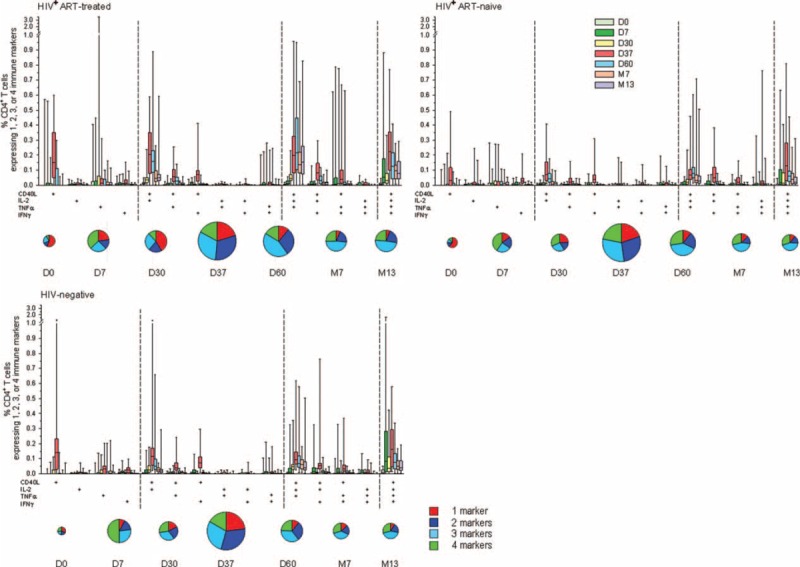
Immune-marker expression profiles following vaccination with M72/AS01. Phenotypes of M72-specific CD4+ T cells expressing (after in-vitro stimulation) single markers and any combination of TNF-α, IFN-γ, IL-2, and CD40L are shown. Box-and-whiskers plots represent the percentages of CD4+ T cells with 1st and 3rd quartiles, and the minimum/maximum values measured. Pie charts represent the mean proportions of cells expressing (after in-vitro stimulation) single markers and any combination of TNF-α, IFN-γ, IL-2, and CD40L marker-positive CD4+ T cells out of the total immune marker-expressing CD4+ T-cell response, at days 0, 7, 30, 37, 60 and months 7 and 13. Pie sizes reflect the mean frequencies (%) of total CD4+ T cells producing at least one marker, relative to the other time-points in the same cohort. IFN-γ = interferon gamma, IL-2 = interleukin 2, TNF-α = tumor necrosis factor alpha.