
FIGURE 3.
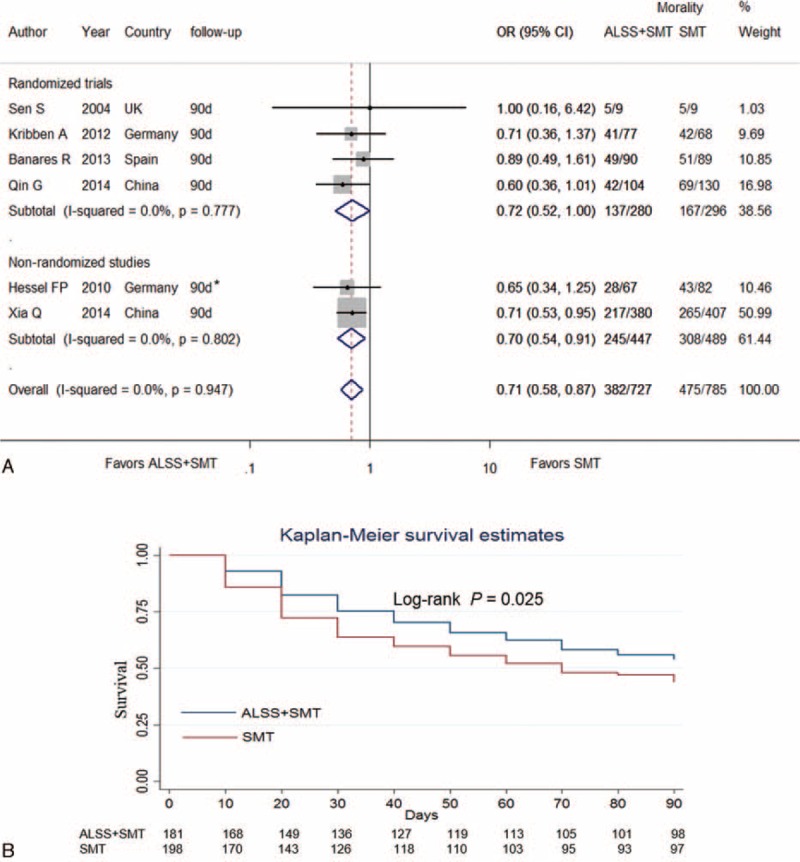
Forest plots showing 3-month mortality in ACLF patients in ALSS groups or control groups (A). Kaplan–Meier curve showing pooled 3-month survival in ACLF patients in ALSS groups or control groups (B). ACLF = acute-on-chronic liver failure; ALSS = artificial liver support system; SMT = standard medical treatment; OR = odds ratio. ∗ The data were extracted by digitizing graphs using the GetData Graph Digitizer (version 2.24, Russian Federation).