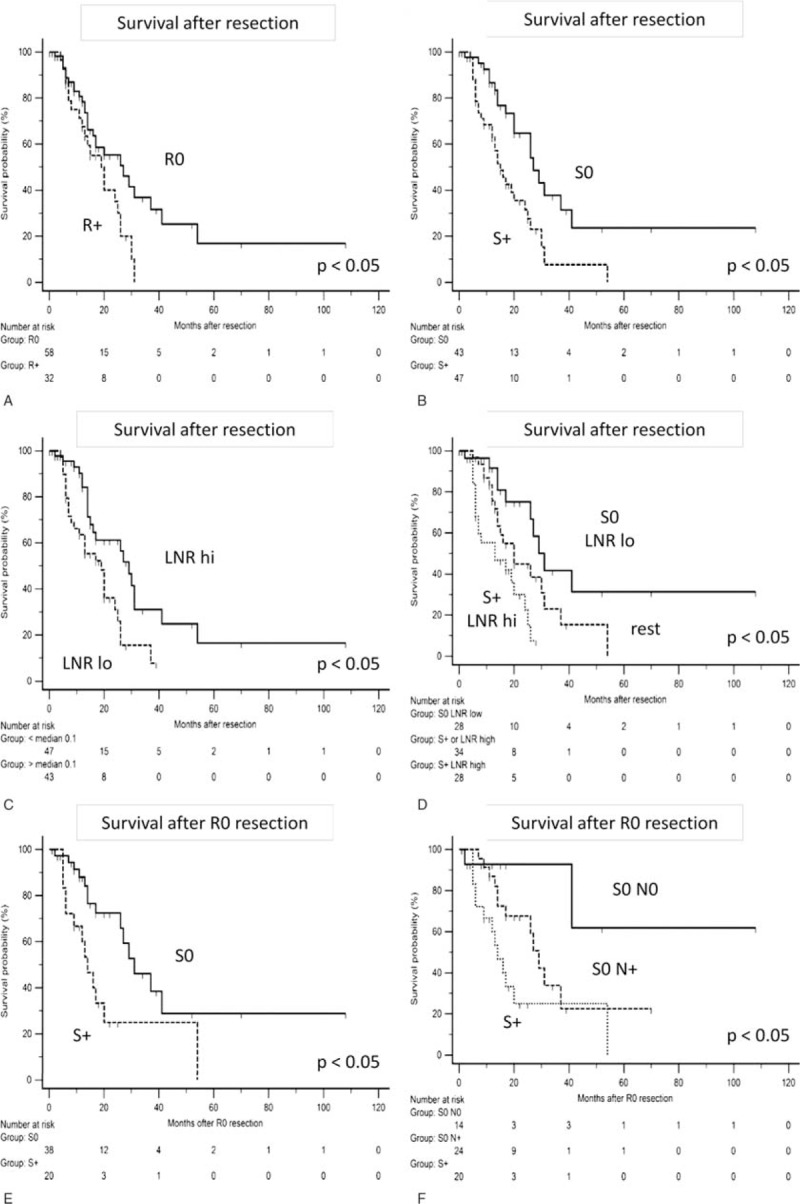
FIGURE 3.

Survival analysis. A–D, Kaplan–Meier plots for comparison of survival after resection of pancreatic head cancer for (A) conventional R0 versus R+ resection, (B) mesopancreatic stroma negative (S0) versus stroma positive (S+) resection, (C) high versus low lymph node ratio (LNR), and (D) patients with S0 margins and low LNR versus patients with S+ margins and high lymph node ratio versus the rest. See also Table 2 for details. E, F, Kaplan–Meier plots for comparison of survival after R0 resection of pancreatic head cancer for (E) mesopancreatic stroma negative (S0) versus stroma positive (S+) resection and (F) patients with S0 resection and no lymph node metastasis (N0) versus S0 resection with lymph node metastasis versus S+ resection. See also Table 3 for details. LNR = lymph node ratio; N0/N+ = locoregional node metastasis absent/present; R-status = conventional resection margin status; R0/R+ = conventional margin negative/positive; S-status = mesopancreatic stromal clearance status; S0/S+ = mesopancreatic margin negative/positive for fibrotic stromal reaction, P values given for 2-sided Logrank test.
