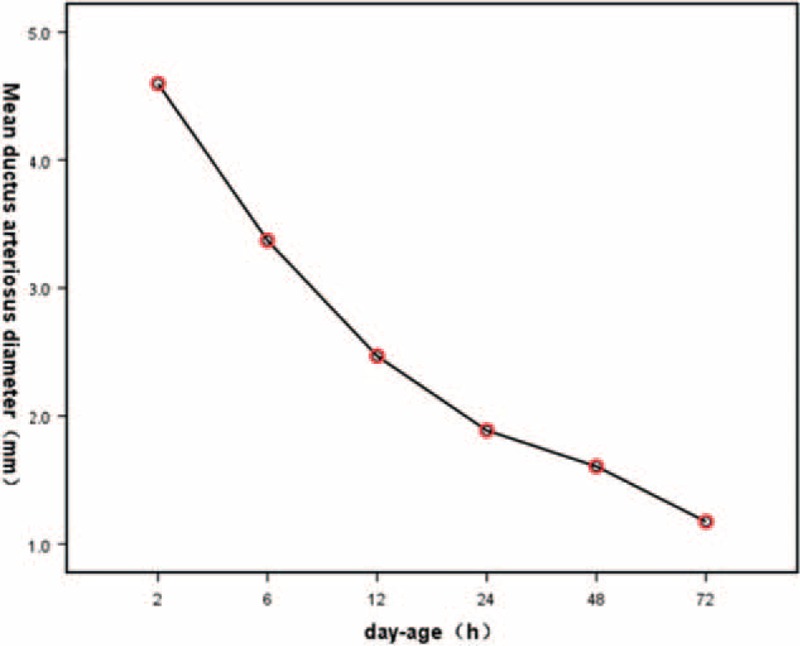
FIGURE 2.

The line graph between day-age and mean value of ductus arteriosus diameter indicated that with the increasing of neonatal day-age, ductus arteriosus diameter decreased gradually.

The line graph between day-age and mean value of ductus arteriosus diameter indicated that with the increasing of neonatal day-age, ductus arteriosus diameter decreased gradually.