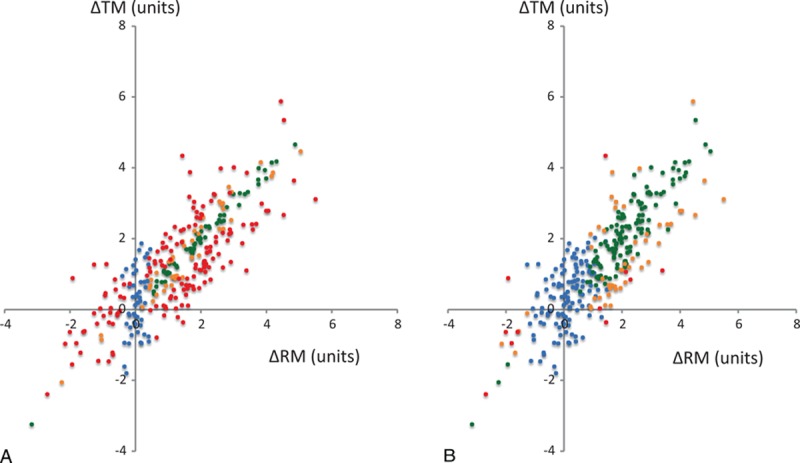
Figure 5.

Simulated data in a 4-quadrant graphical representation using reference method repeatabilities of 5% (A) and 20% (B). A specific color is applied to each change: uninterpretable (blue), noninterchangeable (red), in the gray zone of interpretation (orange), and interchangeable (green). ΔRM = changes in reference method, ΔTM = changes in test method.
