
Figure 7.
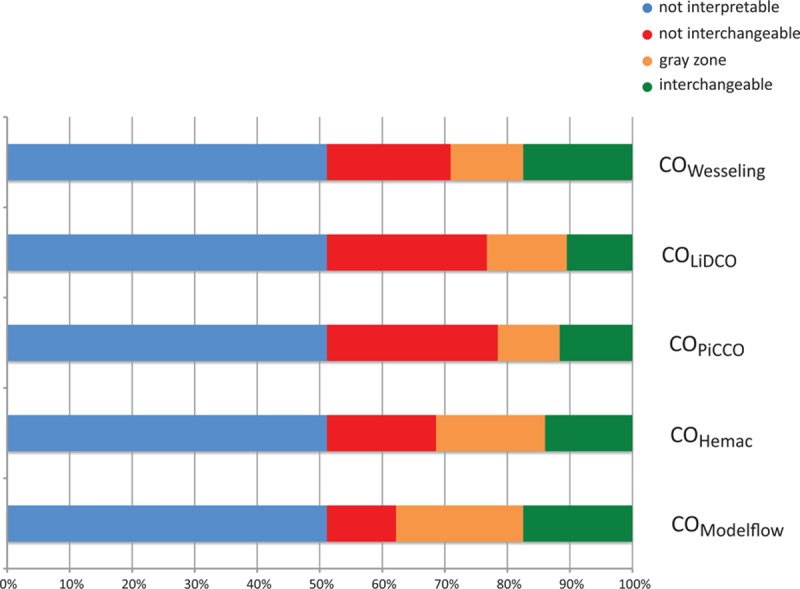
Simplified representation of the original data previously published by de Wilde, comparing cardiac output measurement with thermodilution and 5 arterial pulse contour devices: Wesseling's method (Fig. 6A) LiDCO (Fig. 6B), PiCCO (Fig. 6C), Hemac (Fig. 6D), and Modelflow (Fig. 6E; N = 172). A specific color is applied to each change: uninterpretable (blue), noninterchangeable (red), in the gray zone of interpretation (orange), and interchangeable (green).