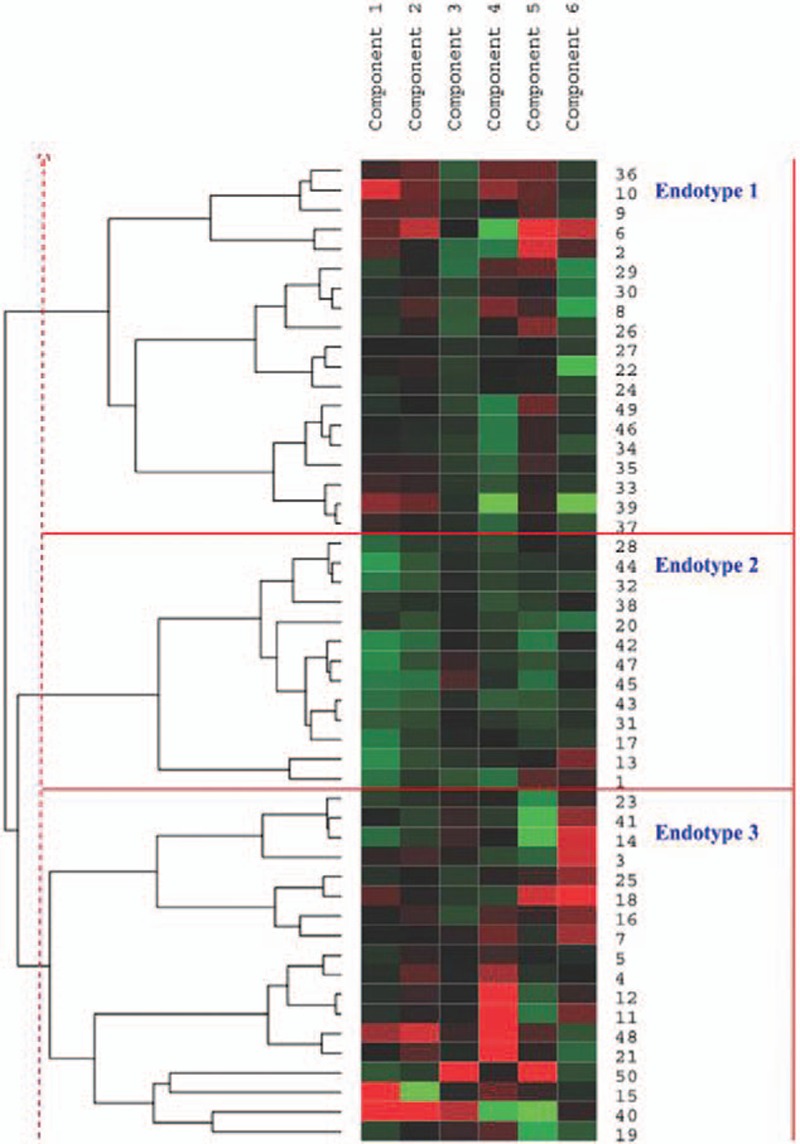
FIGURE 2.

Hierarchical clustering based on PCA. Each column is a component, and each row is an individual patient. Numbers at the right side of the heat map are the patient numbers. Left, dendrogram showing similarity of groups. Right, 3 endotypes are indicated by vertical bars.
