Figure 2.

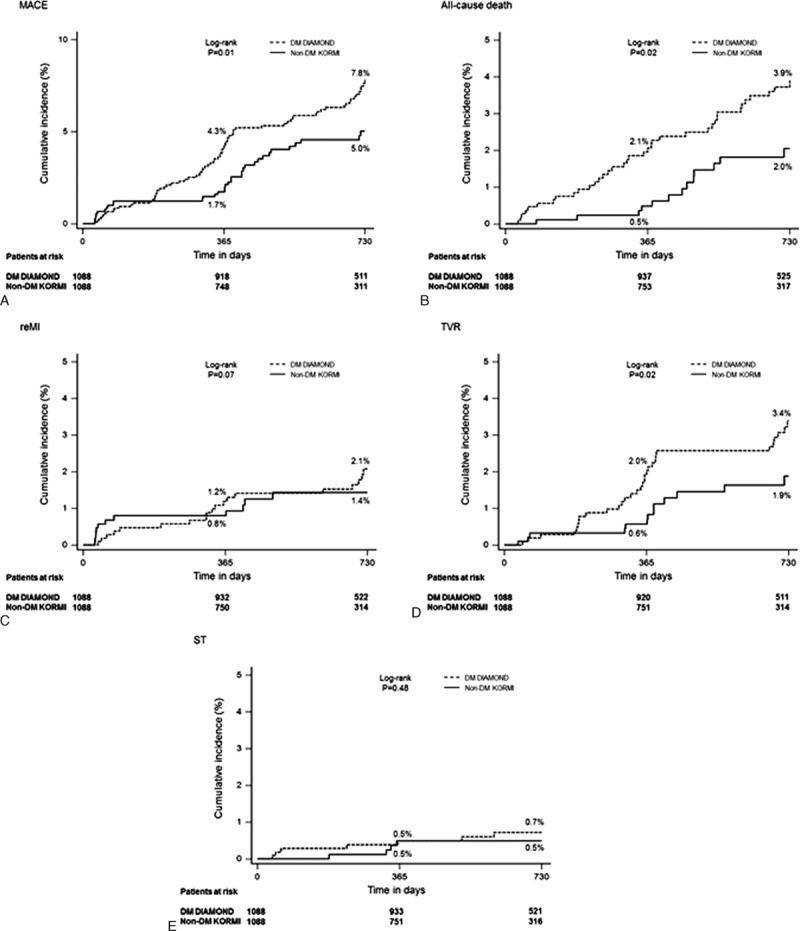
Kaplan–Meier curves for the primary and secondary outcomes according to DM in the propensity score matched population. Cumulative incidence curves are shown for (A) MACE, (B) all-cause death, (C) re-MI, (D) TVR, and (E) ST.

Kaplan–Meier curves for the primary and secondary outcomes according to DM in the propensity score matched population. Cumulative incidence curves are shown for (A) MACE, (B) all-cause death, (C) re-MI, (D) TVR, and (E) ST.