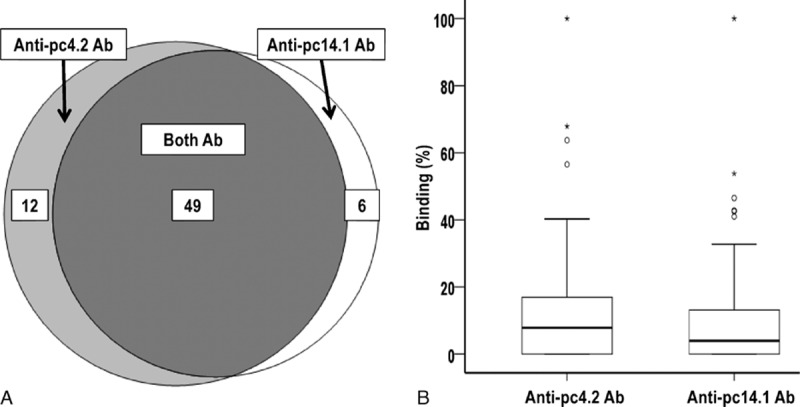
Figure 2.

Subspecificities of the 84 SSc patients’ sera for 2 phage-expressed centromeric protein (CENP)-A-derived peptides. (A) Venn diagram showing overlapping sets of patients with antibodies recognizing peptides expressed by 2 phages; sera from 17 patients did not react with either phage clone. (B) Binding of anti-pc4.2 and anti-pc14.1 antibodies expressed as a percentage of the binding obtained with positive control sera from pt4 or pt14. The horizontal bar marks the median and the box indicates the interquartile range; outlier values (more than 1.5 times the interquartile range) are marked with a circle, while extreme outliers values (more than 3 times the interquartile range) are marked with an asterix.
