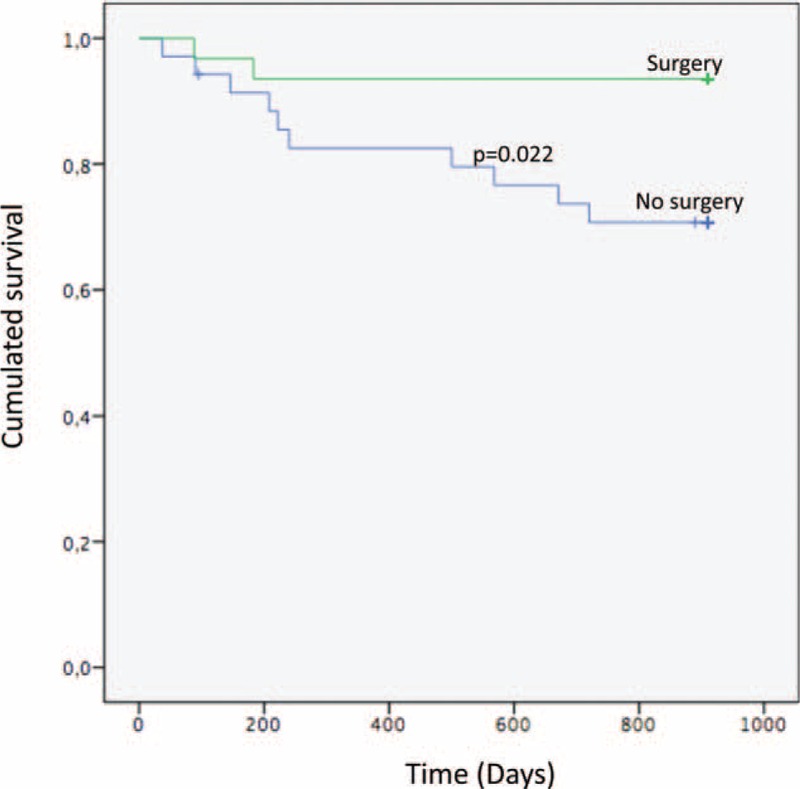
FIGURE 3.

Kaplan–Meier survival curve analysis at 2 and a half years between patients who were operated upon and those who were not.

Kaplan–Meier survival curve analysis at 2 and a half years between patients who were operated upon and those who were not.