
FIGURE 1.
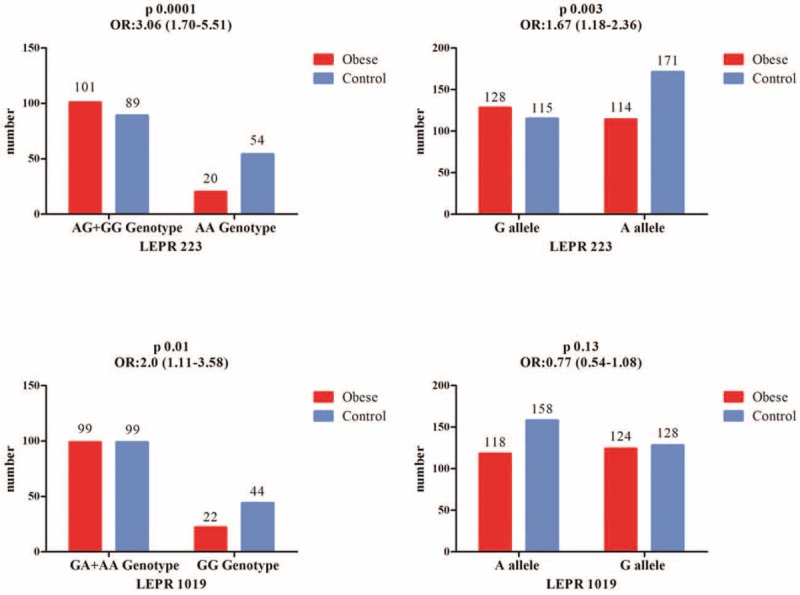
LEPR 223, LEPR 1019 gene polymorphism in obese group versus control group. ∗Reference group, AA = homozygous for A allele; CI = confidence interval; GA = heterozygous; GG = homozygous for G allele; n = absolute number; OR = odds ratio.
Official websites use .gov
A
.gov website belongs to an official
government organization in the United States.
Secure .gov websites use HTTPS
A lock (
) or https:// means you've safely
connected to the .gov website. Share sensitive
information only on official, secure websites.
LEPR 223, LEPR 1019 gene polymorphism in obese group versus control group. ∗Reference group, AA = homozygous for A allele; CI = confidence interval; GA = heterozygous; GG = homozygous for G allele; n = absolute number; OR = odds ratio.