FIGURE 6.

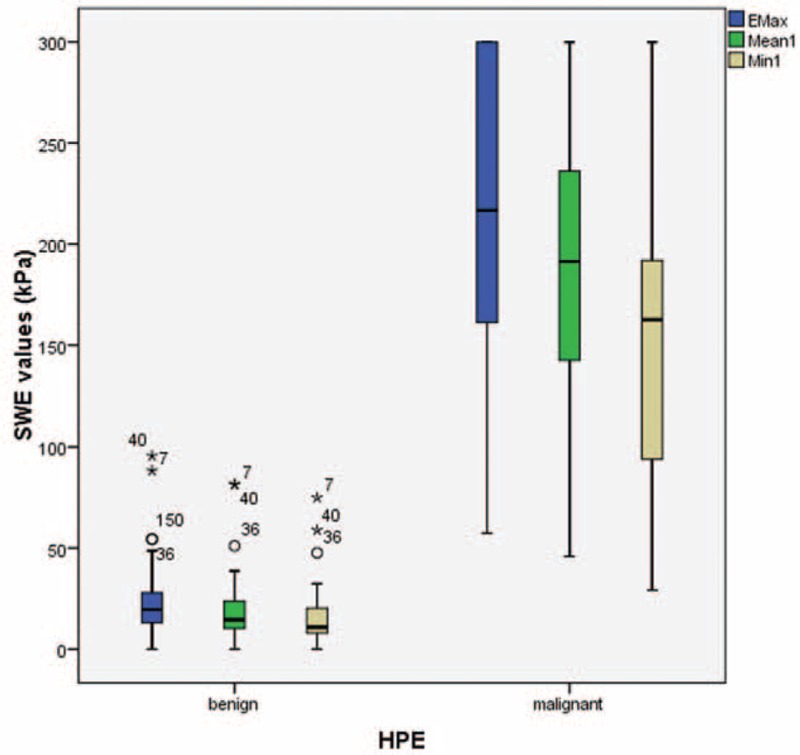
Box plot chart of shearwave elastography (SWE) parameters of benign and malignant breast lesions. According to the Mann–Whitney test, P values are statistically significant between malignant and benign lesions (P = 0.001).

Box plot chart of shearwave elastography (SWE) parameters of benign and malignant breast lesions. According to the Mann–Whitney test, P values are statistically significant between malignant and benign lesions (P = 0.001).