
FIGURE 3.
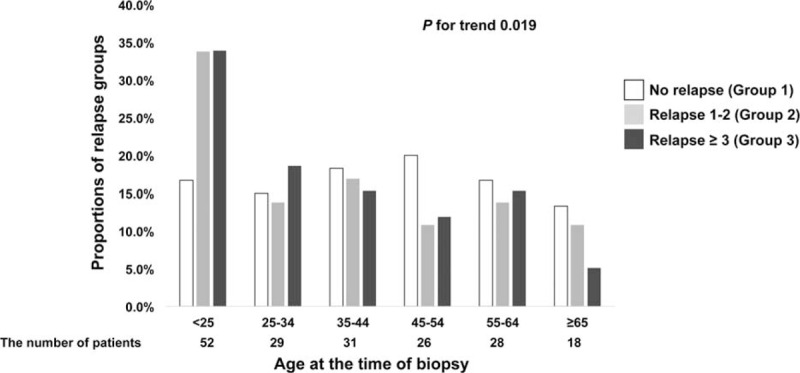
Distribution of relapse groups in 10-year age groups. X-bar means 10-year age groups at the time of initial diagnosis. The number of patients in each age groups are as follows: age < 25 years, 56; 25 to 34 years, 31; 35 to 44 years, 32; 45 to 54 years, 28; 55 to 64 years, 28; and ≥65 years, 20. Y-bar means proportions of relapse groups in each age groups.