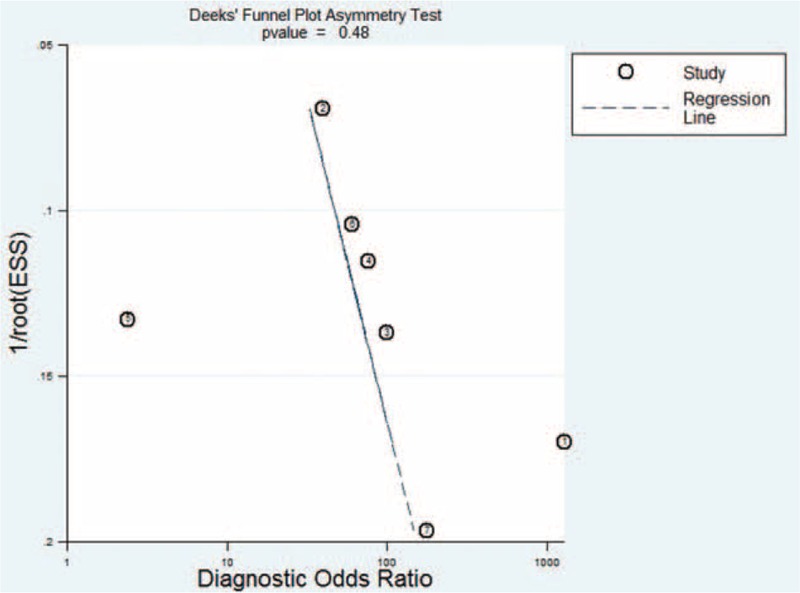
FIGURE 6.

Funnel graph to assess risk of publication bias in studies of the bronchoalveolar lavage enzyme-linked immunospot assay. The funnel graph plots the log of the diagnostic odds ratio (DOR) against the standard error of the log of the DOR (an indicator of sample size). Solid circles represent each study in the meta-analysis. The regression line is shown.
