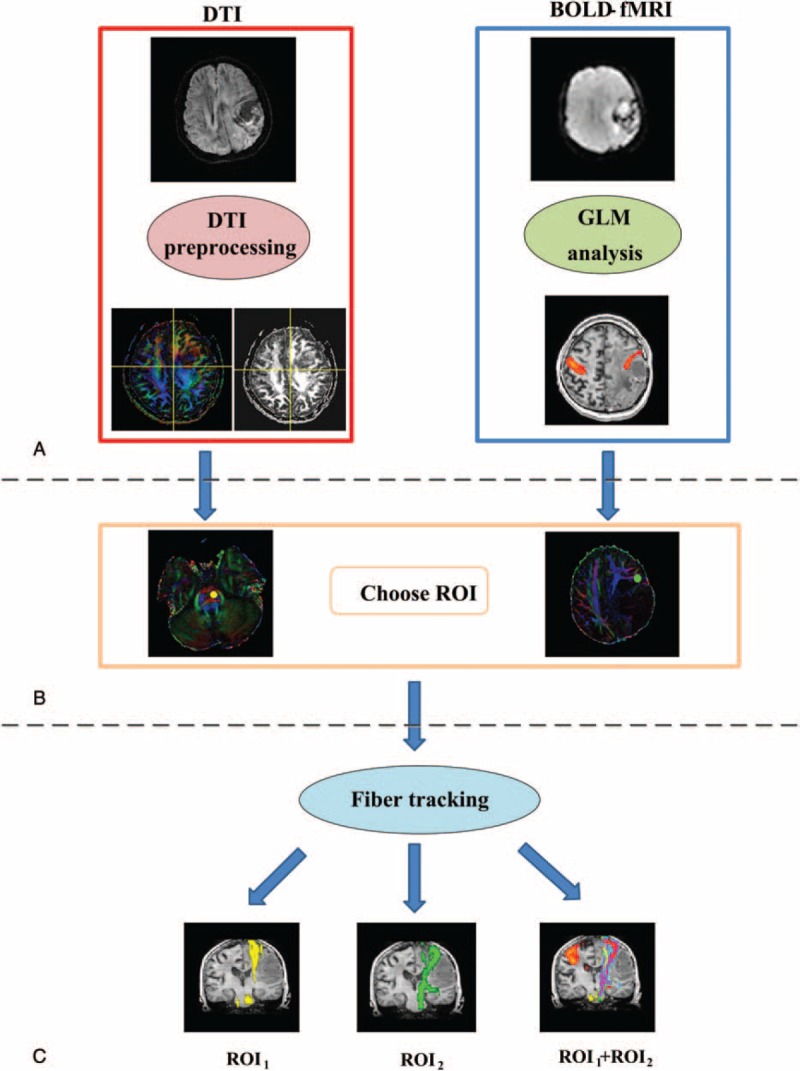
FIGURE 1.

A flow chart of the data-processing steps. (A) DTI and task-based fMRI data analysis. (B) Fiber tracking ROI defined by color-coded FA maps and fMRI activation maps. The pons and PMC are labeled. (C) The CST was tracked using different ROI selection schemes.CST = corticospinal tract, DTI = diffusion tensor imaging, fMRI = functional MRI, FA = fractional anisotropy, PMC = primary motor cortex, ROI = region-of-interest.
