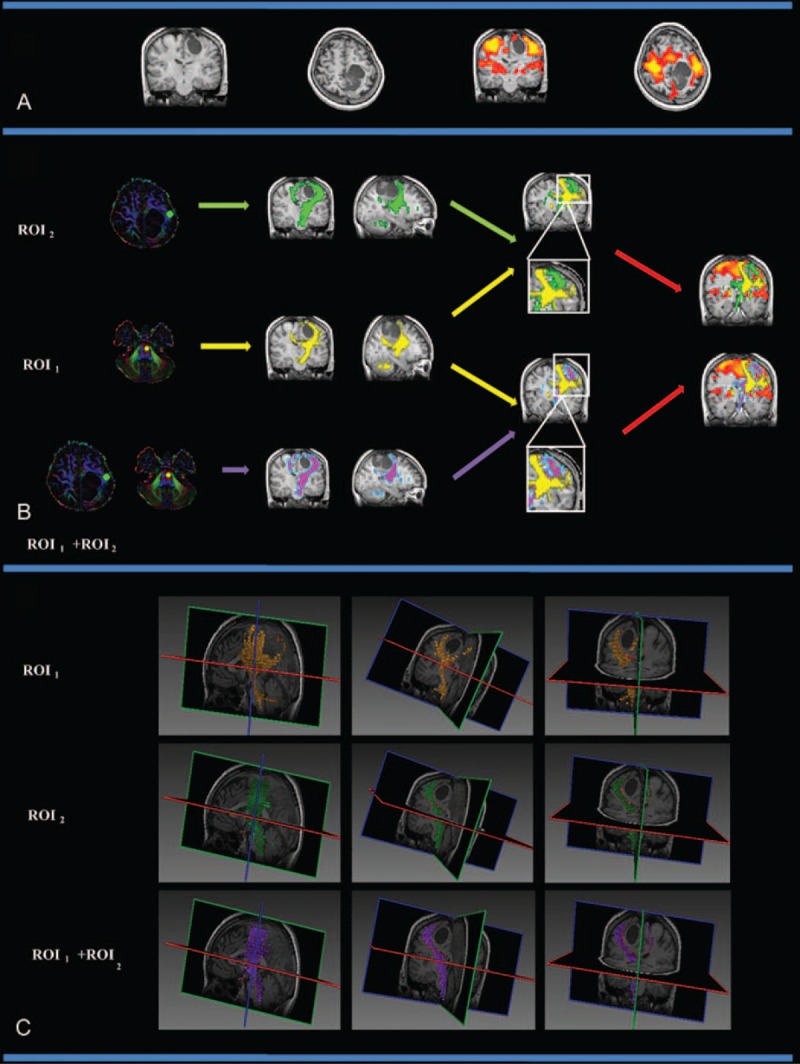
FIGURE 2.

The CST fiber tracking results for patient 1. (A) The lesion and motor-activated area are displayed on a T1-weighted image. (B) The CST fiber tracking results based on different ROI definitions. Yellow, green, and purple represent the CST fiber tracking results obtained using ROI1, ROI2, and ROI1 + ROI2, respectively. The lesion is located in the left motor area, and it did not affect the left internal capsule. Fiber tracking approaches based on ROI2 and ROI1 + ROI2 reached the motor cortex, whereas the reliability of CST tracking solely based on the ROI1 approach was lower due to the tumor mass effect. (C) The 3D visualization of the CST fiber tracking results based on different ROI definitions. CST = corticospinal tract, ROI = region-of-interest.
