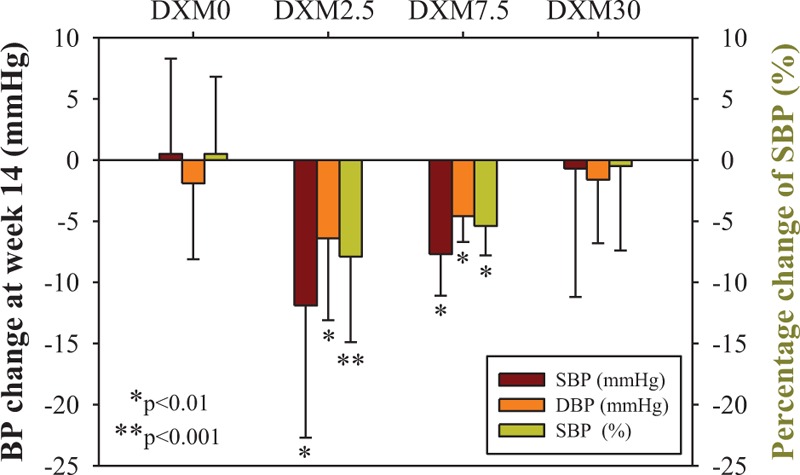
FIGURE 2.

The change of systolic blood pressure (SBP) and diastolic blood pressure (DBP) from baseline (week 2) to end of study (week 14) for each treatment regimen. Four treatment regimens, DXM0, DXM2.5, DXM7.5, and DXM30, were consisted of 31, 16, 6, and 25 patients respectively. P value was examined by paired t test for the comparison of BP value (mmHg) or percentage of change (%) between week 2 and week 14.
