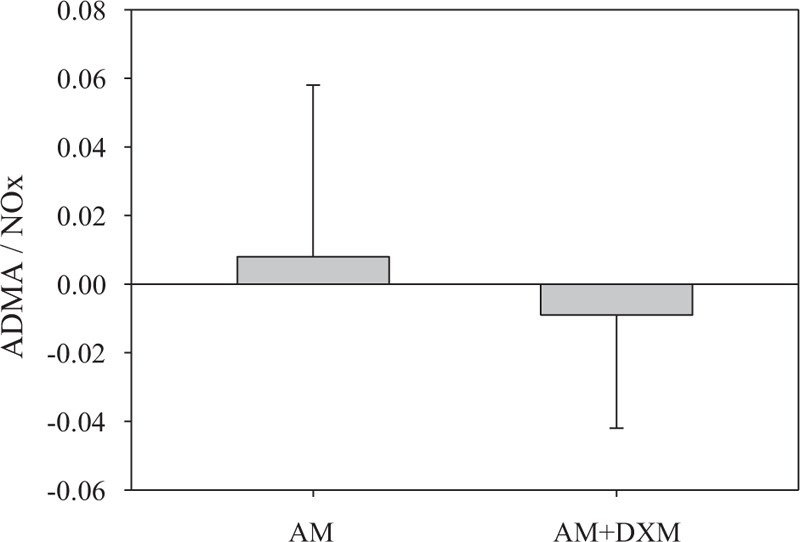
FIGURE 3.

The change of ADMA/NOx ratio from baseline to end of study for responders to AM monotherapy and responders to AM combined with DXM respectively. “AM” represented as the responders to amlodipine monotherapy (N = 29). “AM + DXM” represented as the responders to amlodipine combined with dextromethorphan (N = 25).
