
Figure 6.
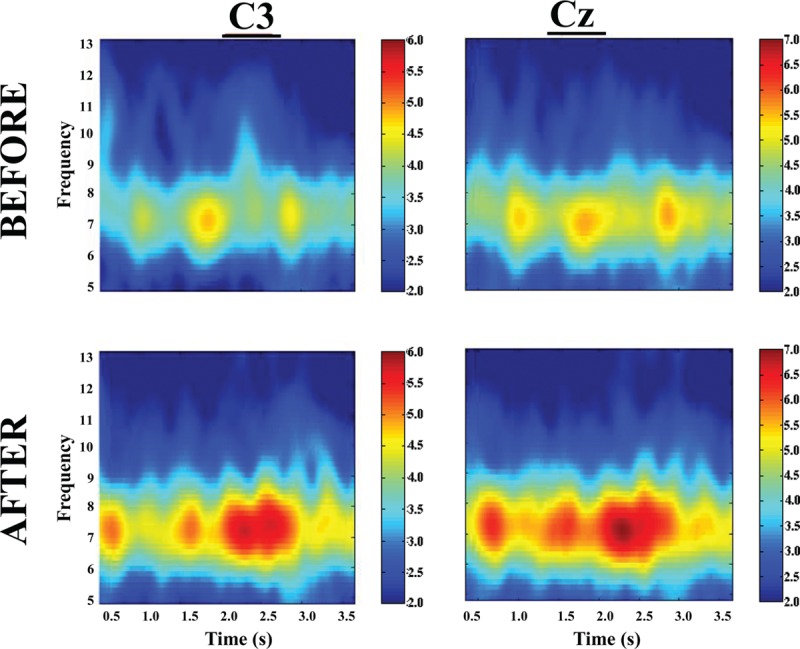
An example of time–frequency–power plots for a subject in the CST group before (top) and after (bottom) training at C3 (left) and Cz (right) recording locations. In each plot, the y-axis indicates EEG frequency and x-axis time points during the MVC trial with time 0 (not shown) depicting beginning of the trial, and color bar on right represents the power scales (red = greater power). Note a clear increase in power at high theta (7–8 Hz) frequency after training.