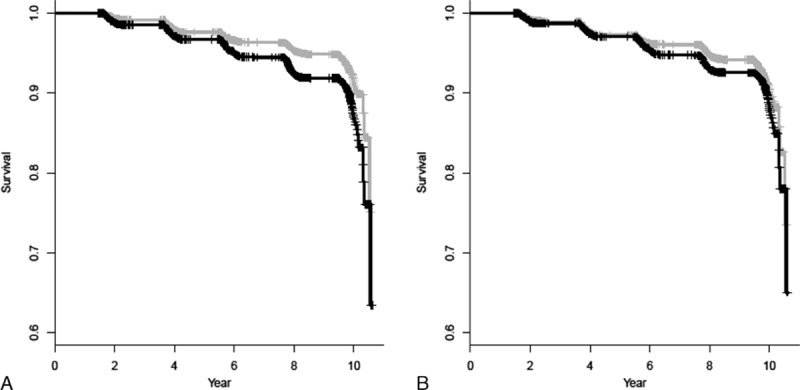
Figure 1.

Kaplan–Meier survival curve for development of cardiovascular disease according to median estimated apoB (A, P < 0.001) and LDL cholesterol (B, P = 0.017) levels. Black and gray lines represent the upper and lower median for corresponding variables, respectively. LDL = low-density lipoprotein.
