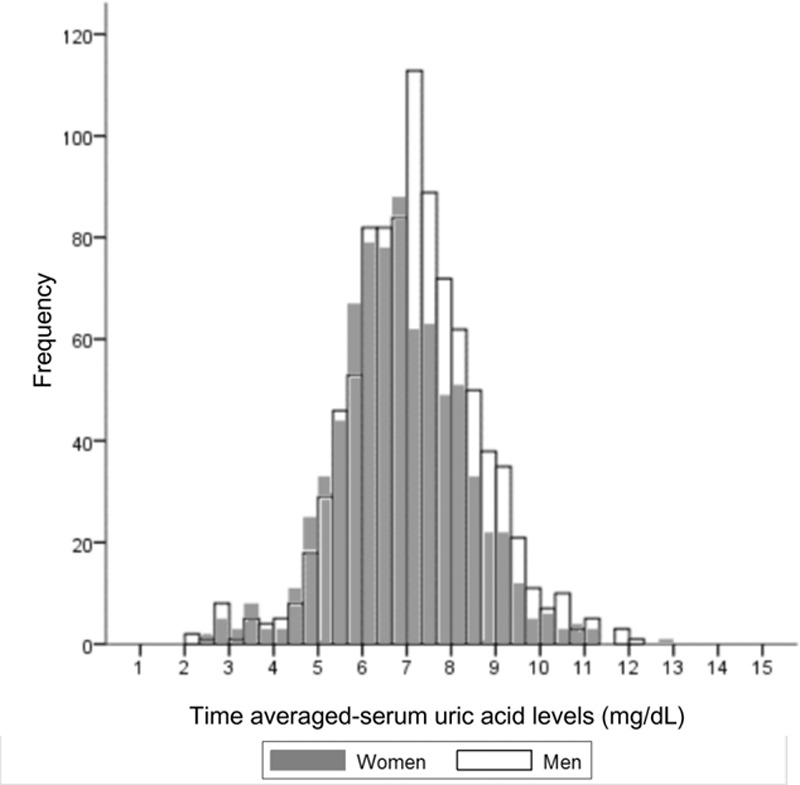
Figure 2.

Distribution of the time-averaged serum uric acid levels according to sex. Most of the time-averaged serum uric acid levels in men (white empty bar) overlap with those in women (gray-filled bar), although they are slightly deviated to the right side.
