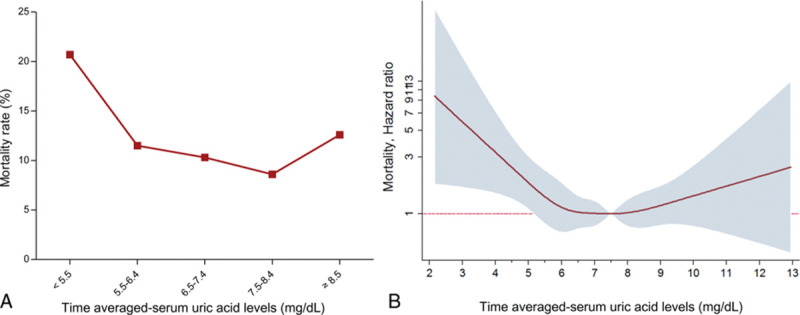
Figure 3.

Mortality rates and hazard ratios according to the time-averaged serum uric acid level. This graph shows the crude mortality rate according to the TA-SUA groups. The lowest TA-SUA group has a significantly increased mortality rate compared with the other 4 TA-SUA groups. The log hazard ratios for mortality in relation to the TA-SUA level are presented. A U-shape relationship is plotted between mortality and the TA-SUA level in patients with end-stage renal disease.
