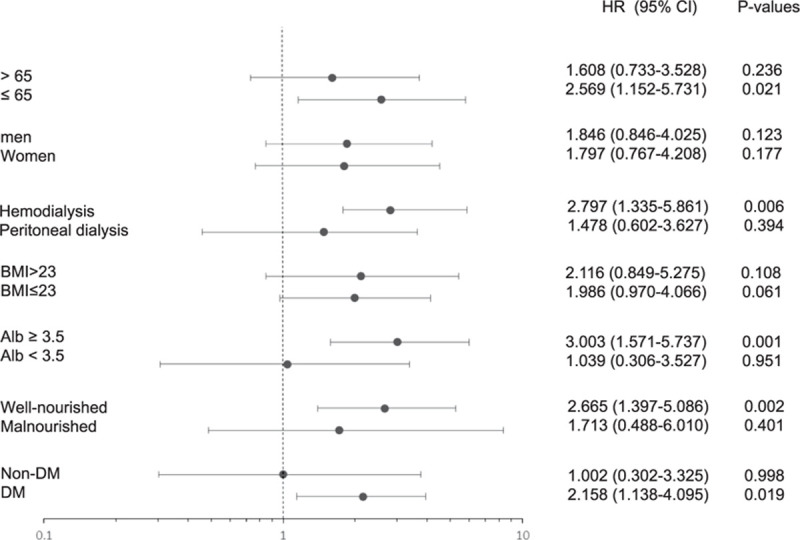
Figure 5.

Stratification analyses. A comparison of the adjusted hazard ratios for the subgroups is presented by forest plot. a Adjusted for age, sex, the dialysis type, body mass index, systolic blood pressure, calcium level, phosphorus level, albumin level, total cholesterol level, uric acid level, subjective global assessment, and DM for each subgroup (excluding its own group).
